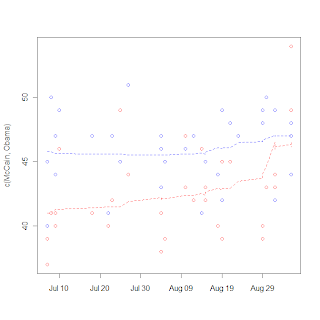
I break from biostatistics for a bit to go into politics, specifically the tracking of polls. Polls are very noisy, and it's really hard to discern real trends (such as convention bounces or even long-term trends toward/away from candidates. The real hard statistical work seems to be in survey selection and sampling, but then on the backend in the reporting not much more is done. Unless you're these guys. So I tried my hand at it a little bit, just being an amateur with a PhD. I collected some poll data and tried my hand a using a LOESS rather than a 3 day moving average. I got the graph on the right.
It's notable that the one point seems to be an outlier (I think that is the Gallup poll that is being criticized in the left-leaning blogs), and McCain's bounce is very noticable, but certainly more data will be needed to show the size of the bounce, as LOESS is susceptible to boundary effects. I do like the fact that LOESS has a longer memory than a moving average and can make the "memory" fade over time rather than either consider it or not. I really wonder what's going to happen to McCain's huge "bounce" with next week's data.