So far (as of Monday, Dec 8), the comments are really just musing about other people's reactions. But it's an interesting question.
On a sidenote, and related more to biostatistics than general statistics, is why a group of people think that the single strongest determining factor of the results of the clinical trial is who sponsors it.
Monday, December 15, 2008
Friday, December 5, 2008
Recommended reading: the cult of statistical significance
While my own blogging languishes (it's the end of the year in pharma and biotech in an era where you have to do more with less), I refer you to John Cook's entry on the cult of statistical significance. The only thing I have to add is that I've seen cases in which where Type II errors are more important than Type I errors, I've seen the bar for statistical significane set at 0.1 rather than 0.5. While less conservative than 0.05, it doesn't erase the fundamental problems with statistical equality testing of safety problems.
Maybe this is why I get the feeling for every protocol that passes my desk that study designers are shooting themselves in the foot.
Maybe this is why I get the feeling for every protocol that passes my desk that study designers are shooting themselves in the foot.
Friday, November 21, 2008
PMean - STaTS reborn?
I have referred to the STaTS pages in the past for statistical references. Sadly, Children Mercy hospital has temporarily taken down the pages, but Steve Simon has resurrected some of his content (and hopes to be able to get all of his content back) and more at pmean.
Thursday, November 13, 2008
Autism and rainfall -- a sadly serious case of lying with statistics
So when I heard of the autism and rainfall study a few days ago, I thought it was a joke out of The Onion or similar publication. I realized today that it was an apparently serious study. Orac dissected the statistical details of the study, so I won't repeat that effort. But I wonder what the next correlate will be. Even more of a stretch is to try to pin this on mercury poisoning by claiming that rain is washing all the mercury out of the sky, with no mention of the seriously circuitous route the mercury would have to take to get from the sky to some small child's brain.
While we don't understand the mechanism of autism nor the relationship between heredity and environment in autism etiology, and while it's certainly a good idea to reduce environmental mercury in every reasonable way we can, suffice it to say that nothing good comes from such a missapplication of scientific and statistical principles to these important issues.
Wednesday, November 12, 2008
Fearmongering in the natural medicine blogosphere
If you peruse my personal blog, you'll probably find that I have a fairly open minded view of alternative medicine. A couple of times, I've taken MD bloggers over at scienceblogs to task over their applications of logical fallacies to arguments against alternative medicines. Unfortunately, logical fallacies, fearmongering, and conspiracy theory are too common in the natural medicines blogosphere. One site has commented about the recent JUPITER study (where rosuvastatin/Crestor(r) was shown to cut cardiovascular events even in people with normal LDL/HDL cholesterol) that (somebody?) was going to force everybody to take statins whether they are healthy are not. This commentary serves nobody, including the consumers of natural or alternative medicine modalities, and is so ridiculous that a moment's thought ought to dismiss the whole commentary.
What questions are raised by the study concern whether the cholesterol levels are enough, or whether inflammation (as measured by C-reactive protein) ought to be considered as well when assessing the risk of heart disease. Another question is whether this effect is common to all statins, or shows up in particular statins. (Could generic simvastatin create the same effect.) A third question is whether the cost is worth the benefit, as the NNT for 1.9 years of treatment (to prevent a cardiac event) is on the order of 120 people. In short, more questions are raised by the JUPITER study than are answered, and public policy toward the consumption of statins is unlikely to change based on this one study.
Update: a newly released study about Lipitor suggests kidney function may be involved, so far at the "association," but not "causation," level.
Edits: some grammar mistakes and clarifications.
Edits: some grammar mistakes and clarifications.
Sunday, November 9, 2008
Study: Cholesterol drugs could help those with healthy levels - CNN.com
Study: Cholesterol drugs could help those with healthy levels - CNN.com
Sounds like the primary mechanism of action in statins isn't lowering cholesterol, but rather reducing C-reactive protein or other inflammation intermediates.
Cholesterol -- total, LDL, and HDL -- are imperfect biomarkers. I think the relationship between heart disease and cholesterol deserves a closer look.
Thursday, October 30, 2008
Stats-based healthcare
Op-Ed Contributors - How to Take American Health Care From Worst to First - NYTimes.com
I agree with the sentiment of the article. We can stand to bring more empirical evidence into our healthcare and use our information technology to improve care. However, I don't agree with the notion that it will be easy. The reason we have more data on our fantasy baseball third baseman is simply that data is easier and less expensive to collect.
The effort that Beane, Gingrich, and Kerry describes will be quite hard, as there are lots of difficulties in electronic medical records that need to be sorted out. But I think it is a necessary effort and will be worth the investment.
Wednesday, October 29, 2008
One major is not included here
10 most popular majors and what they pay - CNN.com
Statistics, of course, wasn't included. However, I can tell you that, depending on what brand of statistics you study (eg industrial, biostatistics, econometrics), the law of supply and demand is on the side of the jobseeker. The downside is that usually a bachelor's degree isn't enough, and the (very) good salaries start with a master's degree.
Statistics, of course, wasn't included. However, I can tell you that, depending on what brand of statistics you study (eg industrial, biostatistics, econometrics), the law of supply and demand is on the side of the jobseeker. The downside is that usually a bachelor's degree isn't enough, and the (very) good salaries start with a master's degree.
Friday, October 17, 2008
Another solution to the R to Word table problem
Last time I used an HTML solution. This time, I create an RTF file:
# function: my.rtf.table
# purpose: convert a matrix, data.frame, or array into a rtf table
# output: text for RTF, possibly written to a file
# inputs:
#  tab - a table, dataframe, or array (needs rownames and colnames)
#  outfile - name of file (or console if NULL, which is default)
#  rtffile - if T (default) then add {\rtf1 to beginning and } to end, making
#            a full RTF file, if F then leave these off
#  header - if T (default) then bold the table header
#  ... - passed to format for the table body only
# tips: output to tempfile and use WordInsertFile(...) from the svViews
#       package to easily convert a table to Microsoft Word
my.rtf.table <- function(tab,outfile=NULL,rtffile=T,header=T,...) {
  if (!is.null(outfile)) sink(outfile)
  tab.nrow<-nrow(tab)
  tab.ncol<-ncol(tab)
  if (rtffile) {
    #begin RTF document
    cat("{\\rtf1\n")
  }
  #populate header row
  cat("\\trowd\\trautofit1\\intbl\n")
  j <- 1
  for (i in 1:(tab.ncol+1)) {
    cat("\\cellx",j,'\n',sep='')
    j<-j+1
  }
  cat("{\n")
  # loop through and write column headers
  cat(" \\cell\n")
  for (i in 1:tab.ncol) {
    if (header) {
      cat('\\b ',colnames(tab)[i],"\\b0\\cell \n",sep='')
    } else {
      cat(colnames(tab)[i],"\\cell \n",sep='')
    }
  }
  cat("}\n")
  cat("{\n")
  cat("\\trowd\\trautofit1\\intbl\n")

  j<-1
  for (i in 1:(tab.ncol+1)) {
    cat("\\cellx",j,'\n',sep='')
    j<-j+1
  }
  cat("\\row }\n")

  #write table contents
  for (k in 1:tab.nrow) {
    cat("\\trowd\\trautofit1\\intbl\n")

    j<-1
    for (i in 1:(tab.ncol+1)) {
      cat("\\cellx",j,'\n',sep='')
      j<-j+1
    }
    cat("{\n")
    cat(rownames(tab)[k],'\\cell\n',sep='')
    for (i in 1:tab.ncol) {
      cat(format(tab[k,i],...),"\\cell \n",sep='')
    }
    cat("}\n")
    cat("{\n")
    cat("\\trowd\\trautofit1\\intbl\n")
    j<-1
    for (i in 1:(tab.ncol+1)) {
      cat("\\cellx",j,'\n',sep='')
      j<-j+1
    }
    cat("\\row }\n")
  }
  if (rtffile) {
    # end the rtffile
    cat("}\n")
  }
  if (!is.null(outfile)) sink()
}
You'll need the package svViews (part of the SciViews series of packages) for this one.
library(svViews)
myfile <- paste(tempfile(),".rtf")
my.rtf.table(table,outfile=myfile)
# use svViews commands to set up Word, if needed
WordInsertFile(myfile)
unlink(myfile)
Basically, what the above does is create a temporary file to hold the RTF document, then write the RTF code to recreate the table, then add the RTF file to Word. The table can then be manipulated as desired. Unfortunately, as the SciViews is Windows only, the automation part of this process is Windows only, but the file creation is not. Since myfile is a string variable, an R function can be written to execute a series of Applescript commands on the Macintosh.
Using R in consulting: playing nice with Microsoft Word
As I use R more in consulting, I'm finding the need to make the quick transition from R to Microsoft products (usually Word) more serious. (I'm using a Windows platform, but I'm sure the challenges on the Mac would be similar.) I simply don't have time to do the text manipulations necessary to convert text to Word tables, for example. There are a few solutions I've tried:
- RWeave and LaTeX2RTF - a bit clunky and producing disastrous results. I really like RWeave, but it's the LaTeX to RTF conversion that's the weak link in the chain here. It simply doesn't work well enough for consulting use. Also, it takes too long to set up when you just want to copy a couple of tables over to Word.
- odfWeave - I'm interested in this solution, but there are a couple of issues. Microsoft support of open document format (ODF) isn't quite there yet, I have to install OpenOffice writer as an intermediary. And I haven't quite gotten odfWeave to work yet, as it requires a command line zip utility and wzcline (the command line interface to WinZip required as a separate download) doesn't seem to work very well yet. Maybe some of the other command lines would work better, but there was a warning as of this writing that the zip utility recommended in the odfWeave help files has a security flaw.
- HTML - I haven't tried the full R2HTML package, but it still seems that this is too much for what I need. It's probably possible to use this to output a basic html file which can then be read into Word, but as of right now that requires too much setup for what I'm doing.
my.html.table function which takes a matrix, data.frame, or array and outputs the html code for a table in the console or a file. Here's the function:
# function: my.html.table
# purpose: convert a matrix, array, or table to an html table
# inputs:
# file - NULL (default) to output to screen, or file name to output to file
# header - F (default) to use for table header, T to use (ignored if
# colnames is F)
# rownames - F (default) to leave out the rownames attribute of the table, T to
# include it in the first column
# colnames - F (default) to leave out the colnames attribute of the table, T to
# include it in the top row (affects header)
# ... - additional parameters are passed to format, affecting the body of the
# table only (not the headers or row names)
# interactions: header is used only if colnames is T
# output: html text (output to a file if file is not NULL)
# tip: use this function, and copy/paste to Excel, and then copy/paste the Excel
# table to easily create a table in MS Word
# note: for more functionality, use the R2HTML package, as this function is
# intended for lightweight use only
my.html.table <- function(tab,file=NULL,header=F,rownames=F,colnames=F,...) {
if (!is.null(file)) sink(file)
nr <- nrow(tab)
cat("<table>\n")
if (header) {
th.tag <- "<th>"
th.tag.end <- "</th>"
} else {
th.tag <- "<td>"
th.tag.end <- "</td>"
}
if (colnames) {
cat("<tr>",th.tag,sep='')
if (rownames) {
cat(th.tag.end,th.tag,sep='')
}
cat(colnames(tab),sep=paste(th.tag.end,th.tag,sep=''))
cat(th.tag.end,"</tr>\n",sep='')
}
for (i in 1:nr) {
cat("<tr><td>")
if (rownames) {
cat(rownames(tab)[i],'</td><td>')
}
cat(format(tab[i,],...),sep='</td><td>')
cat("</td></tr>\n")
}
cat("</table>\n")
if (!is.null(file)) sink()
}
And here's an example:
a<-c(0.5290,0.5680,0.6030,0.6380,0.7050,0.7000,0.7090) b<-c(0.0158,0.0157,0.0155,0.0152,0.0144,0.0145,0.0144) c<-c(87.1350,108.5070,128.6900,149.6190,170.7140,190.6750,211.9240)
foo <- rbind(a,b,c,d,e,f,g)
colnames(foo) <- paste("Col",1:7)
rownames(foo) <- c("Lbl 1","Lbl 2","Lbl 3","Lbl 4","Lbl 5","Lbl 6","Lbl 7") my.html.table(foo)
my.html.table(foo,rownames=T,colnames=T,header=T,digits=2)
my.html.table(foo,width=5)
To easily create a Word table from a matrix, data.frame, or array, just use my.html.table with suitable parameters (including anything that can be passed to format), copy the html from the console, paste into Excel, select and copy from Excel, and paste into Word. It's a little clunky, and maybe through the use of R's clipboard connection I can cut out a step or two, but it's a vast improvement over manual formatting and the bloated solutions listed above.
If you have a better way, feel free to comment.
By the way, using the right-click menu on graphs to copy as a metafile works wonderfully.
If reports are to be updated regularly using changing/updated data, this of course is the wrong solution, and one of the literate programming/weave solutions or appropriately programmed R2HTML is much better.


Friday, October 10, 2008
Liberal vs. conservative visualization
Memeorandum Colors: Visualizing Political Bias with Greasemonkey - Waxy.org
This is more visualization related (still very important, but not exactly what I do), and it's political bias rather than statistics, but this is just so cool I had to link to it.
Sunday, September 28, 2008
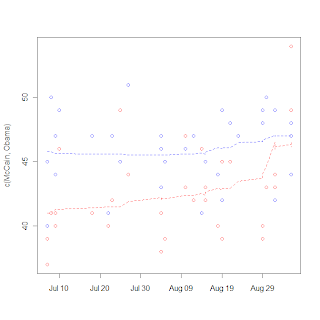
More amateur polling analysis

So I follow up to a previous post exploring polling data by adding a couple of graphs with updated data. The underlying idea is the same - use LOESS to smooth the polls, don't mess with weighting them by quality, etc. I get the graph at the right for the raw polls. There are a couple of things I notice here: the distance between the predicted Obama poll result and 50% is less than the difference between the Obama result and the McCain result. Of course, the smoothing span in the loess might change that (I used loess(...,span=0.2) for this result). However, third party candidates do have the ability to confound matters, and what is more important in terms of who will be taking the inauguration speech on Jan 20 is the state-by-state polling. However, given that the 95% prediction intervals (given by the shading) have separated the McCain story at the state-by-state level is the same as that shown in the graph. 
The difference graph is a little bit clearer (partly because it shows fewer data points). Other than a brief dip below 0 due to the rather sharp Republican convention bounce, Obama's been polling very strongly. These results are very similar to what you would find on Nate Silver's fivethirtyeight.com (where he not only uses the loess but also weights pollsters by quality based on previous elections, newness, and other factors). The 95% interval (light gray) has been clear over 0 for a week and a half (the dark gray is a 50% interval, just to get an idea of the tightness of the difference prediction).
If Nate Silver's analysis of the electoral college is correct (that Obama could go to -2.2 in the difference graph and still come out with an electoral college victory), the only time he was in trouble was in the week after the Republican convention.
Friday, September 26, 2008
DIY poll composition
Pollster.com: 2008 Ohio Presidential General Election: McCain vs Obama
Pollster just released a flash application that allows readers to make their own poll composition graphs. You can control which polls are considered, who is shown, the date range, the amount of smoothing, and so forth. Not perfect, but a good leap forward. For example, I think it would be better to have more smoothing before the conventions, but less smoothing afterwards since the news -- and polls -- have been coming thick and fast since then.
Wednesday, September 17, 2008
Followon to polling post
Seems like the guy at fivethirtyeight.com is pretty on top of polling methods, including modeling of the polling data (weighting by past performance, for example). And he uses good methods at the back end, too.
Only trust facts supported by randomized controlled trials
Because you can't assume anything else is true.
(In case you can't notice the sarcasm, take a deep breath, step back, and click the link. You know you want to.)
Tuesday, September 16, 2008
Everybody involved in the design and interpretation of clinical trials should take this test
Posted over at Radford Neal's blog. Although (frequentist) t-tests and ANOVAs are probably the most common used statistical inferential tools, I've seen the results misinterpreted over and over. And those misinterpretations can lead to some apparent paradoxes, and recommendations based on the conclusion drawn too quickly can make research more confusing, and the job of the statistician harder.
Monday, September 8, 2008
A distraction into the world of polling data
I break from biostatistics for a bit to go into politics, specifically the tracking of polls. Polls are very noisy, and it's really hard to discern real trends (such as convention bounces or even long-term trends toward/away from candidates. The real hard statistical work seems to be in survey selection and sampling, but then on the backend in the reporting not much more is done. Unless you're these guys. So I tried my hand at it a little bit, just being an amateur with a PhD. I collected some poll data and tried my hand a using a LOESS rather than a 3 day moving average. I got the graph on the right.
It's notable that the one point seems to be an outlier (I think that is the Gallup poll that is being criticized in the left-leaning blogs), and McCain's bounce is very noticable, but certainly more data will be needed to show the size of the bounce, as LOESS is susceptible to boundary effects. I do like the fact that LOESS has a longer memory than a moving average and can make the "memory" fade over time rather than either consider it or not. I really wonder what's going to happen to McCain's huge "bounce" with next week's data.
Wednesday, August 20, 2008
More stats sites
Jim Albert has a blog based on his book Bayesian Computation in R. Unfortunately, it seems they haven't been updating it too much recently but it looks like what's there is pretty good.
Monday, August 18, 2008
Matrix square roots in R
There are a couple of ways to do matrix square roots in R. The first is through eigendecomposition:
# a is the matrix for which we want to square root:
a.eig <- eigen(a)
a.sqrt <- a.eig$vectors %*% diag(sqrt(a.eig$values)) %*% solve(a.eig$vectors)
Of course, this only works for positive semidefinite matrices that are diagonalizable (no normal Jordan forms, etc.)
Another way is to use the Denman-Beavers algorithm:
denman.beavers <- function(mat,maxit=50) {
stopifnot(nrow(mat) == ncol(mat))
niter <- 0
y <- mat
z <- diag(rep(1,nrow(mat)))
for (niter in 1:maxit) {
y.temp <- 0.5*(y+solve(z))
z <- 0.5*(z+solve(y))
y <- y.temp
}
return(list(sqrt=y,sqrt.inv=z))
}
This can probably be improved with better convergence criteria, but so far it works well and gives both the square root and inverse square root, both of which are required for many applications.
Saturday, August 16, 2008
Neat, someone else in the niche
On biostatistics and clinical trial. I'm surprised I didn't discover him earlier.
Wednesday, August 13, 2008
Monday, August 4, 2008
Lan-DeMets in R is easier
I found this little gem today. Makes simulating group sequential designs a lot easier, since I don't have to run ld98 every time or something silly like that.
In other news, I got some cool toys from Google at JSM.
Monday, July 28, 2008
Monday, July 7, 2008
There is only one word for results like this: ouch!
The mysterious Condor has posted a (slightly enhanced, but presumably not in a data-changing fashion) graph summarizing a subgroup of an analysis on ENHANCE, and it showed that adding ezetimibe to a statin regimen didn't do any good. At all. The one apparently statistically significant good result for the 2nd quartile IMT looks spurious to me and really makes no sense except as a Type I error. Conversely, the statistically significantly bad result for the 3rd quartile looks like another Type I error. Overall, this look like nothing, or if anything a modestly negative effect.
Ouch!
Sunday, July 6, 2008
How can "functional unblinding work"?

So, continuing in a series on blinding (i.e. the hiding of treatment group assignments from study personnel until all the data have been collected and cleaned and analysis programs written), I will talk about possible ways to do so-called "functional unblinding" -- that is, effectively getting an answer on a drug's treatment effect before treatment codes are released for analysis. Here I will assume that treatment codes are actually remaining sealed (so we aren't talking about "cheating"). This kind of cheating is a serious breach of ethics and merits its own discussion, but I'm saving that for another time.
Also, this post was inspired by the ENHANCE trial and the fallout from it, but I'm not going to make any further comment about it except to say that there are a lot of other features to that situation that make it, at best, appear suspicious. (And to the wrong people.)
So, on to the question, "Is it possible to determine a treatment effect without unblinding the trial?" My answer: a very risky yes, and in some circumstances. I think it is going to be very difficult to show that no treatment effect exists, while a huge treatment effect will be clear. Since I'll be throwing several statistical tools at the problem, this post will only be the first in a series.
The first method is graphical and is called kernel density estimation. This method has the nice feature that it can quickly be done in R or SAS (and I think most other statistical packages) and shows nice graphs. Here I simulated 3 possible drug trials. The first one, the treatment had no effect whatsoever. In the second one, the drug had what I would consider a moderate effect (equal to the standard deviation of the outcome). In the third one, the drug had a huge effect (and probably what would not commonly be seen in drug trials today--3 times the standard deviation of the outcome). I ran the default kernel density estimate in R (using the density() function with defaults), and came up with the image accompanying the post. The top graph looks like a normal distribution graph, as one would expect. The middle graph also looks like a normal distribution, but it is more spread out than the top one. The third one clearly shows two groups.
Identifying huge effects seems to be pretty easy, at least by this method. Identifying moderate effects is a whole lot harder, and distinguishing them from no effect is a bit risky.
However, this isn't the only method of analyzing this problem, and so I will talk about some other methods next time.
Wednesday, July 2, 2008
Grassley thinks blinding doesn't matter, at least in ENHANCE
So, I've been meaning to discuss this for some time, and will do so, but I will note that Sen. Grassley thinks blinding doesn't matter on the ENHANCE trial, that simulations could have been run to assess statistical significance on the basis of blinded data.
Of course, this is disturbing on several levels. I'm going to argue that kind of analysis is possible but risky. At the same time, this will make blinding arguments much weaker. As it stands now, anyone who lays eyes on an unsealed randomization schedule, the results of an unblinded analysis, or any summary that might involve unblinded analysis is considered unblinded and therefore should not make decisions that influence further conduct of the study. The worst case scenario of this new argument is that anybody with blinded data and the potential knowledge of how to assess statistical significance based on blinded data will be considered unblinded.
Now, we're getting into murky territory.
Wednesday, June 18, 2008
Cognitive dissonance with graphs
 This is from the Wall Street Journal blog, who has more money for copyeditors than I do. Leaving aside my distaste for pie graphs, take a look at what's wrong with this graph.
Because this is such a major issue, you would think that someone would catch this mistake before production?
But, in the spirit of Junk Charts, I'll offer the way I think this should look. I think the insured/uninsured/underinsured lines need to be plotted over time on a single line graph to support the author's point, which is that the underinsured population has grown over time.
PS. The original report is here. All of the supporting displays are eye-gouging tables. I made the chart I suggested, and even with Excel Defaults, it beats the heck out of the pie chart.
Saturday, June 7, 2008
How safe is safe enough?
So, another short post while real life takes it out of blogging.
Is 100% safe enough? 99% safe enough? Let's make this more specific and say that the risk being talked about is irreversible morbidity or death. How safe is safe enough?
Hard as it is to believe, I'm linking to Orac a second time. Here, Orac discusses risk in the context of the Green our Vaccines rally.
I think what will be useful is a table, a direct comparison of risk of irreversible morbidity or death for those who have been vaccinated vs. who have not been vaccinated. Of course, herd immunity is going to confound this table somewhat, but I think such a table with some explanation about what can go wrong under each scenario will be very useful.
Epi wonk?
Tuesday, June 3, 2008
Do you think Bayesian?
Because I'm in the weeds right now, I'm not finishing up my third installment of blinding and randomization. I will, however, refer you to an blog entry that discusses the notion of whether our learning faculties implicitly use Bayesian statistics.
Sunday, May 25, 2008
Blinding and randomization, Part II
I could title this post "things that go bump with blinding and randomization." The nice, clean picture I presented in the first part of this series works a lot of the time, but usually, there are problems.
Before I go into them, there's one aspect I didn't touch in the first part, and that is the business aspect. And that's what concerns Schering-Plough -- if they were unblinded to trial results they could possibly make financial decisions, such as "cashing out" while shareholders are stuck footing the bill for trial results. I usually don't mess with that end of things, but it's a very important one for management of companies.
Ok, so back to things that go bump:
- It's hard to make a placebo. Sometimes, it's really hard to match the drug. If there's an actively-compared trial, what happens if the active control is an intravenous injection and the experimental treatment is a pill? You could dummy up so that everybody gets an IV and a pill (and only one is active), but if you get too complicated, there's too much room for error.
- The primary endpoint is not the only expression of a drug. For example, if your drug is known to dry out skin, and a patient presents with a severe skin drying adverse event, your investigator has a pretty good idea of what the assigned treatment is.
- If all outcomes come back pretty close to each other, relative to uncertainty in treatment, you have a pretty good idea the treatment has no effect. While this may not unblind individual patients, it gives a pretty good idea of trial results during the writing of analysis programs, and presumably to senior management so they can make decisions based off "very likely" results.
It's the third case I want to treat in some detail, and the third case that relates to the ENHANCE trial.
Wednesday, May 14, 2008
Blinding and randomization: the basics
Before I start talking too much about if it's possible to effectively unblind a study without knowing treatment codes, it will be helpful to establish why blinding is important. (Also called masking.) In a nutshell, these techniques, when applied correctly, correct our unconscious tendencies to bias results in favor of an experimental treatment.
Randomization is the deliberate introduction of chance into the process of assigning subjects to treatments. This technique not only establishes a statistical foundation for analysis methods used to draw conclusions from the data in the trial, but also corrects the well-known tendency for doctors to assign sicker patients to one treatment group (the experimental treatment if placebo-controlled, or active control if the active control is well-established, e.g.).
Blinding is the keeping secret the treatment assignment from either the patient, the doctor, or both. (Statisticians and other study personnel are kept blinded as well.) Single-blind studies maintain treatment assignment from the subject. Double-blind studies maintain treatment assignment from both the subject and doctor. I have run across a case before where the doctor was blinded to treatment assignment but not the subject, but those are rare.
For some examples of kinds of bias handled by these techniques, see here.
If a particular patient experiences problems with treatment in such a way that the treatment assignment has to be known, we have ways of exposing just the treatment assignment of one patient without having to expose everybody's treatment assignment. If all goes well, this is a relatively rare event. That's a big "if."
At the end of the study, ideally we produce the statistical analysis with dummy randomization codes in order to get a "shell" of what the statistical analysis will look like. This analysis is conducted according to some prespecified plan that is documented in the study protocol and a statistical analysis plan. In many cases, we will draw up in Microsoft Word or other editing software a shell of what the tables will look like. (I've heard about some efforts at using OASIS table model for both shells and analysis.) When we are satisfied with the results, we drop in the true randomization codes (seen for the first time) and hope nothing strange happens. (Usually, very little goes awry unless there was a problem in specifying the data structure of the true randomization codes.)
Any analysis that occurs afterward might be used to generate hypotheses, but isn't used to support an efficacy or safety claim. If something interesting does come up, it has to be confirmed in a later study.
Ideally.
What happens when things aren't so ideal? Stay tuned.
Tuesday, May 13, 2008
Ban abbrs!
So, maybe this is a little bit radical, but I think we should stop using abbreviations. We have the technology to automatically expand abbreviations in writing, so that advantage is pretty much lost. For anyone who is a nonlinear reader and writer, the rules create a huge waste of time -- you have to track the first use of an abbreviation in order to expand it and put it in a table of abbreviations. For a nonlinear writer, who might write the introduction after the body, this can get cumbersome. For a nonlinear reader, such as someone who uses SQ3R or similar method, it creates an irritation to have to thumb back to a table of abbreviations (and another huge waste of time).
So, how about it, style guide writers? Time to move grammar out of the IBM Selectric age?
Thursday, May 8, 2008
Can the blind really see?
That's Sen. Grassley's concern, stated here. (A thorough and well-done blog with some eye candy, though I don't agree with a lot of opinions expressed there.)
I've wondered about this question even before the ENHANCE trial came to light, but, since I'm procrastinating on getting out a deliverable (at 11:30pm!) I'm going to just say that I plan to write about this soon.
Saturday, May 3, 2008
Critical thinking about vaccines
I encourage people to think critically about vaccines (just like any other topic). However, pseudoskepticism about vaccines (just like any other topic) is harmful because discouraging others from vaccinating leads to a rise in, for example, whooping cough. Orac has also written about the rise in measles in the wake of decreasing vaccination.
Remember, the decisions you make about vaccination affect others as well. Some critical thinking about vaccines is good -- for example knowing when to go ahead or delay a shot due to illness (or knowing what conditions may lead to a life-changing reaction). However, a blind rejection is as bad as blind acceptance.
Friday, May 2, 2008
Well, why not?
Since I'm posting, I might as well point toward Derek Lowe's post about the failure of the Singulair/Claritin idea. Too bad for Merck, though one has to wonder how long this drug combination strategy among big pharma is going to play out. After all, wouldn't it be about as cheap to take two pills (since one is over-the-counter) as it would be to ask your insurance to fork it over for a prescription version of a combination? Heck, a lot of people take the combination separately now, anyway.
So at any rate, Derek deduces that the problem lies in efficacy. Is it possible to support a marketing claim that the combination is more than the sum of its parts? Merck apparently thinks so, but the FDA does not. Unless there's an advisory committee meeting on this, or the drug eventually gets approved, or efforts to get results of all clinical trials posted publically succeed, we won't know for sure. But what I do know is that for one of these combinations to gain marketing approval, at the very least there has to be a statistically significant synergistic effect. That means that the treatment effect has to be greater than the sum of the treatment effects of the drugs alone. Studies that demonstrate this effect tend to have a lot of patients, especially if there are multiple dose levels involved. It isn't easy, and I've known more than one combination development program to fizzle out.
Update: but see this serious safety concern for Singulair reported by Pharmalot.
It's easy to make silly claims when you take numbers out of contexts
I often respect Mark Schauss, but when he shows his hatred of the pharmaceutical and healthcare industries his logic tends to go out the window.
Take for example his latest silly claim "stay out of hospitals to live longer." Ok, I guess one could make the argument that behaviors or genetic predispositions that lead one to a hospital stay would probably tend to shorten life. Fair enough. But rather than taking that fairly obvious argument, we are treated to a naked number: 99,000 deaths from nosocomial (hospital-related) infections per year. Rather than delve into that number, Mark simply calls it "unacceptable."
Granted, we all want to reduce that number. But let's take a closer look by reviewing the report on which Mark bases his post. (Link is a pdf.)
The infection rate per 1,000 patient-days was highest in ICUs (13.0), followed by high-risk nurseries (6.9), and well-baby nurseries (2.6).
Now, let's think about the claim that people are better off out of the hospital than in the hospital. The highest infection rates are in ICUs and high risk nurseries. Well-baby nurseries registered as well. Sounds to me like if someone needs to be in one of these places, they have some pretty serious problems, and infections considered, in the hospital is better than outside the hospital. I doubt that bolting from the ICU to avoid infection is going to, in the long run, lead to a longer life.
99,000 is a number we all want to go down to zero, and I suspect that more judicious use of antibiotics, solving the problems with overtired and overworked healthcare practitioners, and avoiding drug dispensing and therapeutic errors will all be part of the solution. But before we go making any silly conclusions based on this number, let's see what the problems really are and solve them rather than cut off our noses to spite our faces.
Saturday, April 12, 2008
This is why I keep my internal emails clean
Every once in a while I will express frustration about a client in an email, but I don't use profanity in emails and chats (these things are logged, too). Why?
Well, while my emails are unlikely to get plastered all over the interwebs, I do realize they can reach a wider audience than their intended audience. Don't forget, the things are discoverable, too. That means the lawyers can get 'em.
Thursday, April 10, 2008
Getting the hands dirty
I don't very often write the SAS code to produce tables and listings anymore. There are other people who do it a lot better than I, and I do a lot of other things better than write SAS code. But I've had the occasion to do it recently, and, I have to admit, it's a reminder of why I didn't go down the SAS programmer path (and a reminder of the fact that things really do take a long time to produce, at least correctly).
Monday, February 25, 2008
The buzz
Every once in a while I look through the keyword referrals and do an informal assessment of how people find this blog -- one that's geared for a rather narrow audience. Here are the most popular keywords:
- O'Brien-Fleming (especially doing this kind of design in SAS)
- Bayesian statistics in R
- noninferiority
- NNT (number needed to treat)
- confidence intervals in SAS
On occasion I will get hits from more clinical or scientific searches, such as TGN1412 (the monoclonal antibody that caused a cytokine storm in healthy volunteers, leading to gangrene, multiple organ failure, and for those lucky/unlucky enough to survive, cancer), Avandia, or CETP inhibitors.
At 2000 hits in a year, this is clearly a narrowly-targeted blog. :D
Tuesday, February 5, 2008
When you consult, be sure you know what your labels mean
In a recent project, I fit a varying slopes and intercepts model to data that was organized into replicated experiments, with several replications at each timepoint for several timepoints. Turns out, the only relationship between units labeled "Run 1" was the label. Nothing else. In this case, it turned out a simple linear regression was the more appropriate model.
Tuesday, January 29, 2008
The hammer, or the sledgehammer? A small study in simulation
RKN over at Epidemiology blog had a small problem he solved using simulation:
I have been interested in the following question: if there are, let's say, 5 genes involved in the liability of fx risk, and each gene has two alleles with one of them conferring a greater risk, what is the chance that an individual will have 0, 1, 2, 3, 4, or 5 risk alleles?
Obviously, the answer depends on the allelic frequency. I am too lazy to work out by algebraic probability, so I have conducted a simple simulation (using SAS) as follows:
There are 5 genes with allelic frequencies being 1%, 5%, 10%, 15% and 20%
Assuming that they are independent (zero linkage disequilibrium)
He then programmed a short simulation in SAS using 100,000 replicates. However, remembering the advice at this site, I wondered if SAS's random number generator was up to the task. The period of this generator (a linear congruential generator) is 232-1, and the quality decreases after the production of the square root of this number of pseudorandom numbers. (Around 216, or 65536.) At 500,000 numbers, the quality of the random numbers should start to decrease.
I didn't run the battery of tests on the numbers, but I did replicate the experiment using R, which uses the Mersenne twister as its default generator. I got the following as a result:
0 1 2 3 4
0.57481 0.34678 0.07177 0.00633 0.00031
This isn't too far off of what RKN got. So maybe the sledgehammer wasn't necessary here.
Sunday, January 27, 2008
Is it ever OK to change the primary endpoint?
One of the recent points for discussion in the recent ENHANCE trial was whether it was ethical to change the primary endpoint of the trial. Ed Silverman writes in his Pharmalot blog
We’ve written this before, and we will write this again: changing a primary endpoint - and doing so without consulting the lead investigator - is inappropriate. And failing to provide more meaningful updates to a widely anticipated trial much sooner in the process only caused skepticism and suspicison. And naming a so-called independent panel without releasing names compounds the matter, especially when some panel members aren’t independent. If Merck and Schering-Plough execs are upset over “mischaracterization,” they have only themselves to blame.
I want to focus in on one statement: "changing a primary endpoint ... is inappropriate."
There are a few points here I want to quickly discuss. In the opinion of this statistician, it is sometimes appropriate to change primary endpoints. The conditions under which this radical change is appropriate may or may not all have been met in the ENHANCE trial. However, while a change in primary endpoint ought to be enough to raise suspicions (and such a change is not to be done lightly), it should not be, by itself, enough to sink a study.
So, without further ado, circumstances where it may be appropriate to change primary endpoints:
Circumstance and discussion Met in ENHANCE?
The change must be decided before the study is unblinded. Making the change after the study is unblinded is enough to sink a study, even if an independent board is the only group who is unblinded.
Yes. The study was unblinded on Dec 31, 2007 (if we believe the press release, but the FDA should be able to audit this).
It would be very useful for the primary investigator (PI) to be involved in the decision. While statistically not necessary, from an operations point a view the PI has been trusted with the scientific responsibility of the study, and so should have input on the primary endpoint.
No, and, as Silverman points out, this casts further doubt on an already suspicious act. The composition and independence of the board who made the decision is unclear, and this may be an issue in the coming weeks.
There should be a good scientific reason for preferring the new endpoint over the old. Sometimes the reason is statistical (for example, an old endpoint may be much less powerful than a new one) or operational (eg. recruitment projects were way off target), but in any case the scientific justification of the new endpoint needs to be well established.
This is unclear. The claim is that there were difficulties in interpreting the old endpoint - the intima media thickness (IMT) - which is essentially the thickness of artery walls which must be determined from ultrasound images. Determining medical measures for clinical trials from imaging is a difficult task, even for areas such as arthritis where the measures are now standard.
Sometimes, there may be a plan to select a primary endpoint based on the data, but the algorithm for this needs to be specified in advance and the operating characteristics of the procedure, such as Type I error and power, need to be understood and specified. If this is the case, the primary endpoint can be chosen after unblinding, but the algorithm should be programmed before unblinding and should adhere to the plan exactly. Indeed, this is a tricky situation, and such a plan should only be used in extenuating circumstances.
I don't think so. I think if ENHANCE had an adaptive hypothesis we would know that by now (but this is not guaranteed - don't want to place too much weight on an appeal to consequence). At any rate, this is auditable, since the plan has to be written and signed.
The study is a pilot trial and the sponsor is prepared to deal with a selection bias.
No, ENHANCE was not a pilot trial. Instead, as can be seen from the news and stock, this trial had major financial and medical consequences.
Personally, I'm not quite ready to point my finger and yell "j'accuse!" at Schering-Plough and Merck quite yet, at least over attempting to change their primary endpoint in ENHANCE. I certainly will follow the facts that bubble up with great interest, though.
Saturday, January 19, 2008
The NNT returns
I've discussed the number needed to treat from a statistical point of view before. To review, the NNT is interpreted as the expected number of people who need to be treated (including drug, duration of treatment, and so forth) to receive a specified benefit (recover from a disease, or, in the case of prophylactic treatment such as statins, avoid a bad event).
John Mack of Pharma Marketing blog discusses a BusinessWeek article entitled "Do Cholesterol Drugs Do Any Good?" In these discussions, they reprint a table giving the estimated NNTs for various drugs, including atorvastatin (Lipitor™, Pfizer). I've reprinted (without permission, but hey it's circulating all over the globe) below:
 Mack, like any good marketing guy, sensationalizes the findings in this tables by calling this "the statin lottery." We are treated to an attempt at an explanation of the NNT:
250 people are recruited to participate in the contest. Each person gives me $1,000 and after 1 year one person in the group--selected at random--will receive $250,000 (250 people x $1,000). I keep the interest earned.
I'm not really clear what this analogy has to do with the NNT, but call me skeptical of the lottery analogy and even of the following statement by Dr. Nortin Hadler:
Anything over an NNT of 50 is worse than a lottery ticket; there may be no winners
Both the images of lottery and the statement basically claim that there is not benefit to taking statins. But I argue differently. These arguments against statins are based on bamboozling readers with big numbers, ignoring the payoff of taking statins vs. costs, and ignoring the fact that the use of statins is a very personal decision to be make carefully.
So, on to big numbers. I don't know why Dr. Hadler picked 50 as a cutoff for NNT. He may have given a reason in the interview that wasn't reported (or maybe I missed it), or maybe he just picked a number out of the rectal database. Given that the NNT is tied to a specific clinical outcome, course of treatment (including dose and frequency), and other specific medical events the analogy with lotteries break down. Never mind the fact that lotteries typically have winning chances of less than 1 in a million. So the 1 in 50 number just seems arbitrary. After the quote, we are shown higher NNTs for statins (70-250 and 500+), and have the upper range of that singled out for discussion. Why not discuss 70? Why not discuss the harmonic mean 109 (1/(1/70 + 1/250)), which is probably the right NNT estimate assuming that 70-250 is a confidence interval? Not impressive enough, I guess.
In light of the payoffs, I wonder if 1 in 70-250 even looks so bad. What is the balance of avoiding a freakin' myocardial infarction vs. taking 5 years of statins (assuming you have high blood pressure). Most of the cardiovascular events have a high cost in terms of money, healthcare resources, stress, and lifestyle modifications. What is the tradeoff between taking 5 years of statins (including chance of adverse events and money) and cardiovascular events? For each individual person, I don't know. How about 1 in 500 to avoid death or other "serious medical events" (presumably more serious than a myocardial infarction)? That's something to decide with a doctor. What is the NNT of avoiding MIs in people who have a family history of heart disease or other risk factors more than hypertension?
And the NNT can be a very useful statistic to use in that decision, as long as it is considered in context. Notice in the table there are 3 NNTs associated with statins, depending on the risk factors and the events to avoid. There's more NNTs not listed in the table. And, for context, we are given antibiotics for H. pylori ulcers and Avandia. The reason these are singled out for the table is not given, and it would have been very easy to give a simple chart of NNTs for many common medications. Statins might have looked as bad, worse, or better. It all depends on the context. The risk factors that are intimately tied in with NNTs are not discussed beyond people who have had a heart attack and people who merely have high blood pressure. For example, history of heart disease is not discussed. Finally, the uncertainty in calculating an NNT needs to be acknowledged by showing a confidence interval.
In short, I really appreciate that BusinessWeek discussed the NNT statistic. It is definitely a useful and easily interpretable figure that can be used in medical decision making. However, the simplifying explanations given leave out some useful and necessary information on how exactly to use that statistic to make medical decisions both on a personal and a policy level. I do understand the fact that we are overmedicated, but I also believe it is better to understand the phenomenon and base our course of action on reality than sensationalize it and feed the counterproductive pharma-bashing frenzy.
Wednesday, January 16, 2008
Notable addition to the blogroll
I just found a new biostatistics blog called Epidemiological Methods. The posts I've looked at so far are high quality, and the blogroll is high quality as well.
Oh, and via that, I found a Bayesian Stats blog, too.
Monday, January 14, 2008
Not "ENHANCE"-ing the public image of science, but it does show the power of the scientific method
The recent brouhaha over the Merck/Schering-Plough ENHANCE study can be pointed to as a triumph of science. SP clearly tried to pull a fast one by convening a "panel of experts" to determine the endpoint of the ENHANCE trial long after data was collected. Statistically, of course, this amounts to data dredging and is rather dishonest and unethical, not to mention unscientific. The power of science, after all, lies in our ability to predict outcomes based on our present data and current understanding of how things work, not picking outcomes on the basis of past data.
Our current safeguards have turned back a major assault on our sensibilities. I do feel bad for the Vytorin team because, well, they've gone this far into the development process and had a major setback. But as for the geniuses who decided to try to break the rules, I hope they find a different line of work. Having applied research help the public depends on a certain degree of trust, and shenanigans like this only serve to erode that trust.
As for me, I'm glad we've come this far in our ethical development as scientists to at least catch these blatant cases. But Congress is already trying to bang down our doors calling for more controls. I'm afraid there's more of our act to clean up.
As a note, Derek Lowe has a nice analysis of the clinical and statistical issues.
Sunday, January 6, 2008
A level-headed skeptical assessment of echinacaea
It seems that almost everyone either loves or hates echinacaea. Or, at least, there's a vocal core group of people that espouses its miraculous wonders as a cold remedy, and another equally vocal crowd that wants the first to shut up.
At any rate, the research on echinacaea has been mixed and confusing, which is par for the course for an extract of a natural product.
Stats.org just released a commentary on some shoddy reporting of the research, and a resource at the Mayo Clinic shows just how confusing the research has been on echinacaea in particular.
One note about the Stats.org commentary is worthy of a "lying with statistics" article. Articles from Bloomberg, NTY, and LA Times all reported that prophylactic use echinacaea reduced the rate of getting colds by about 65 percent. However, this number is the reduction in the odds of getting a cold, not a reduction in the probability of getting a cold (about 30 percent). Statistically, the concepts of odds and probability are way different, and the reporting of the odds in this case made echinacaea look way better than the reference study would indicate.
That's not the only issue, but I refer you to the Stats.org article for more ways of inoculating yourself against questionable reporting of statistics.
One last comment: it doesn't seem the author is against echinacaea or thinks that it is ineffective, but is simply evaluating the quality of the evidence and the reporting of the evidence.
Subscribe to:
Posts (Atom)


