Thursday, August 2, 2012

JSM 2012 in the rearview: reflections on the world's largest gathering of statisticians

The joint statistical meetings is an annual gathering of several large professional organizations of statisticians, and annually we descend on some city to share ideas. I'm a perennial attendee, and always find the conference valuable in several ways. I have a few thoughts about the conference in retrospect:

* For me, networking is much more important than talks. Of course, attending talks in your area of interest is a great way of finding people with whom to network.
* I'm very happy I volunteered with the biopharmaceutical section a couple of years ago. It's a lot of work, but rewarding.
* This year, I specifically went to a few sections out of my area, and found the experience valuable.
* I definitely recommend chairing a session or speaking.
* I also recommend roundtable lunches. I did one for the first time this year, and found the back and forth discussion valuable.

In short, I find that connecting with like-minded professionals to be an important part of my career and development as a person.


Wednesday, May 30, 2012

Statistical leadership, part IV: the world needs you

Read this, even if you are not a statistician. Go on, I'll be here when you get back.

This article was adapted from Roger Hoerl's excellent Deming Lecture at the Joint Statistical Meetings in 2011. This is a call to action, of course, but a call to something even deeper. In a time when we are running very short on critical thinking, we need more people to think critically and speak up. Critical thought, of course, implies more than just speaking against something (the status quo, proposed solutions, or other object of thought), but rather seeking a deeper understanding of the problems that face us, and what the most effective solutions are. In this imperfect world of tradeoffs, we have to understand the impact of solutions and of solving problems.

This is a call to understand our world, and to make it better. (The former does not necessarily precede the latter.)

Tuesday, May 15, 2012

Thoughts on privacy

As this world gets more connected, and as data storage and analysis advances, we have to change our notions of privacy and data stewardship. About 25 years ago, right before email hit the big time and data analysis methods were limited to small datasets or Cray supercomputers, having data was a huge deal. Coverups, such as Watergate, were characterized by hiding data from others. While still true, it’s a lot harder, and, with increases in computing speed and availability of data, it’s a lot harder to hide from the rest of the world.

Whether we like it or not, our notions of privacy have to change. In a recent instance, Target knew of a daughter’s pregnancy before her father did. (Mailings to the house were the source of a lot of consternation and an uncomfortable chat.) Doing this is fairly easy: you assign an ID number to each customer based on credit cards or loyalty cards, mine purchase data for what can predict not just pregnancy but also a due date, and apply it to future customers. Many first year statistics grad students have already learned the basic methods for doing this. This cat is out of the bag, and it’s not going back in. We will not be able to legislate this practice out of existence (and perhaps we shouldn’t be, anyway).

So what now? How does privacy have to change? It appears that a new attitude toward privacy is rising, but this is equally disturbing. In the link, teens were given Blackberries, with the understanding that everything they did on it would be monitored and analyzed, and they still went for it. They even did drug deals using these devices!

I think our privacy laws have to evolve to deal with this new reality. We require de-identified data for data released to the public, but even that strategy will only be useful for so long. No, the bounds of acceptable behavior based on data have to be re-thought. For example, is it ok to drop insurance coverage based on FB postings of drunken parties or certain tweets? Is it ok to terminate an employee because a manager did some social network analysis of public data and found some badmouthing of the company? Is it ok for a car insurance company to bump up your premium because you blogged about Top Gear? Answering these kinds of questions, which really are just a couple of steps away from product recommendations, with legislation will just be the start.

Monday, April 30, 2012

Statistical leadership part III–shameless plug for PharmaSUG talk

PharmaSUG is a yearly gathering of SAS programmers who program for the pharmaceutical industry. This year, Dr. Katherine Troyer of REGISTRAT-MAPI will be giving a talk entitled “Giving Data a Voice: Partnering with Medical Writing for Best Reporting Practices,” in which she will implore the audience to get statisticians, medical writers, SAS programmers, clinicians, data managers, and any other stakeholder together early and often in the clinical trial process. While it may seem like the medical writer may only need to come into the process late, they actually have to put everything together. In the spirit of beginning with the end in mind, planning should include all of us.

If you’re going to PharmaSUG this year, please attend this talk!

Monday, April 23, 2012

Coursera (and other online classes)

A revolution is taking place in education. Last fall, Stanford University premiered three online classes in Artificial Intelligence, Machine Learning, and Introduction to Databases. I took Machine Learning and Intro to Databases, and this spring I’m taking Probabilistic Graphical Models, Natural Language Processing, and Model Thinking.

This winter and spring, that effort has evolved into Coursera, and the course offering has expanded to about 30 courses across disciplines and difficulties. Other universities, such as the University of Michigan, UPenn, and Princeton have gotten in on the action. Other professors have their own effort called Udacity (which concentrates on computer science and artificial intelligence after the primary interest of Sebastian Thrun of the Google robotic car), and MIT has developed their own platform.

So far all my classes have been through have been high quality. There are a few glitches as Coursera is blazing trails here, but overall I’m happy to take a small part in this revolution.

Wednesday, March 21, 2012

Using R for a salary negotiation–an extension of decision tree models

Let’s say you are in the middle of a salary negotiation, and you want to know whether you should be aggressive in your offering or conservative. One way to help with the decision is to make a decision tree. We’ll work with the following assumptions:

  • You are at a job currently making $50k
  • You have the choices between asking $60k (which will be accepted with probability 0.8) or $70k (which will be accepted with probability 0.2).
  • You get one shot. If your asking price is rejected, you stay at your current job and continue to make $50k. (This is one of those simplifying assumptions that we might dispense with later.)

This simplification of reality can be represented with a decision tree:

blogpayoff

I went ahead and put in the expected payoff for each of these decisions. Because the more conservative approach has a higher expected payoff, this model suggests that you should take the conservative approach.

One shortcoming clearly is that this decision tree only shows two decisions, but really you have a range of decisions; you are not stuck with $60k or $70k for asking price. You might go with $65k, or $62.5k, or something else. So what would be the optimal asking price?

Again, we look at expected payoff, which is asking price*probability(offer accepted) + $50k * probability(offer rejected). In this case, we need to model the probability that offer is accepted over the range of possible offers, not just the two points. The logistic model works very well for modeling probability, and that’s what I will use here to extend the two-point model. In fact, a logistic model with two parameters can be fit exactly to two points, and so that is what I will use here.

Here is my commented R code to implement this model:

my.offer <- function(x1=60,py.x1=.2,x2=70,py.x2=.8,ev.no=50,high=100,p.payoff=1) {
# return the offer to maximize expected payoff
# this assumes a game with one decision and one consequence
# you give an offer, and it is taken or refused. If taken, you receive a salary of
# (a function of) the offer. If refused, you stay at the old job and receive a
# salary of ev.no (presumably a current salary, but set to 0 if you are
# unemployed).
# the probability of rejection is modeled with a logistic function defined by
# two points (x1,py.x1) and (x2,py.x2)
# for example, if you expected a 20% rej. prob. with an offer of 140k, then
# x1,py.x1 = 140,.2. Similarly with x2,py.x2
# the expected payoff is modeled as offer*P(Yes|offer) + ev.no*P(No|offer),
# perhaps with modifications to account for benefits, negotiation, etc. This
# is defined in payoff function below.
# finally, high is defined as anything above what you would be expecting to offer
# and is used to create the plot limits and set the bounds in the optimization
# routine.   # model the probability of no given salary offer
# here we have a logistic function defined by (x1,py.x1) and (x2,py.x2)
# note that qlogis is the inverse logit function
# also, matrices in R are defined in column-major form, not row-major form like
# FORTRAN, so we have to use 1,1,x1,x2 rather than 1,x1,1,x2
theta <- solve(matrix(c(1,1,x1,x2),nc=2),matrix(qlogis(c(py.x1,py.x2)),nc=1))   # for plot of probability function
xseq <- seq(ev.no,high,length=100)
yseq1 <- 1/(1+exp(-theta[1]-theta[2]*xseq))   # model the expected payoff of an offer
# model negotiations, benefits, and other things here
# (a simple way to model benefits though is just to change ev.no)
payoff <- function(x) {
tmp <- exp(-theta[1]-theta[2]*x)
return( (ev.no + ifelse(ev.no>x*p.payoff,ev.no,x*p.payoff)*tmp)/(1+tmp) )
}     yseq <- payoff(xseq)   # plots
par(mfrow=c(1,2))
plot(xseq,yseq1,type='l',xlab='Offer',ylab='P(No|X)')
plot(xseq,yseq,type='l',xlab='Offer',ylab='Expected salary')   # no sense in even discussing the matter if offer < ev.no
return(optimize(payoff,interval=c(ev.no,high),maximum=TRUE))
}

Created by Pretty R at inside-R.org


And here are the graphs and result:
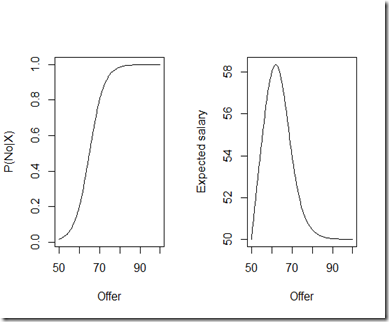

image

> my.offer()
$maximum
[1] 61.96761

$objective
[1] 58.36087

So this model suggests that the optimum offer is close to $62k, with an expected payoff of around $58k. As a side effect, a couple of graphs are produced: giving the probability of rejection as a function of the asking price, and the expected salary (payoff) as a function of asking price.


So a few comments are in order:


  • The value in this model is in varying the inputs and seeing how that affects the optimum asking price.
  • The function I provided is slightly more complicated than what I presented in this post. You can model things like negotiation (i.e. you may end up at a little less than your asking price if you are not turned down right away), differences in benefits, and so forth. Once you have a simple and reliable baseline model with which to work, you can easily modify it to account for other factors.
  • Like all models, this is an oversimplification of the salary negotiation process, but a useful oversimplification. There are cases where you want to be more aggressive in your asking, and this model can point those out.
  • I commented the code profusely, but the side effects are probably not the best programming practice. However, this really is a toy model, so feel free to rip off the code.
  • This model of course extends to other areas where you have a continuous range of choices with payoffs and/or penalties.
  • If you are able to gather data on the probability of rejection based on offer, so much the better. You can then, instead of fitting an exact probability model, perform a logistic regression and use that as the basis of the expected payoff calculation.

Monday, March 5, 2012

Why I hate p-values (statistical leadership, Part II)

One statistical tool is the ubiquitous p-value. If it’s less than 0.05, your hypothesis must be true, right? Think again.

Ok, so I don’t hate p-values, but I do hate the way that we abuse them. And here’s where we need statistical leadership to go back and critique these p-values before we get too excited.

P-values can make or break venture capital deals, product approval for drugs, or senior management approval for a new design of deck lid. In that way, we place a little too much trust in them. Here’s where we abuse them:

  • The magical 0.05: if we get a 0.51, we lose, and if we get a 0.49, we win! Never mind that the same experiment run under the same conditions can easily produce both of these results. (The difference between statistically significant and not significant is not significant.)
  • The misinterpretation: the p-value is not the probability of the null hypothesis being true, but rather the long-run relative frequency of times that data from the similar experiments run under the same conditions will produce a test statistic that is at least the value that you had in your experiment, if the null hypothesis is true. Got that? Well, no matter how small your p-value is, I can get a wimpy version of your treatment and get a smaller p-value, just by increasing the sample size to what I need. P-values depend on effect size, effect variance, and sample size.
  • The gaming of the p-value: in clinical trials it’s possible to make your p-value smaller by restricting your subject entry criteria to what brings out the treatment effect the most. This is not usually a problem, except to keep in mind that the rarified world of early phase clinical studies is different from the real world.
  • The unethical gaming of the p-value: this comes from retrospectively tweaking your subject population. I guess it’s ok if you don’t try to pass this off as real results, but rather as information for further study design, but you can’t expect any scientific validity to tweaking a study, its population, or its analysis after the results are in.
  • Covariate madness: covariates tend to decrease the p-value by partitioning the variation in drug effect. That’s great if you want to identify segments of your patient population. But if you do covariate selection and then report your p-value from the final model, you have a biased p-value.

Statisticians need to stay on top of these issues and advocate for the proper interpretation of p-values. Don’t leave it up to someone with an incomplete understanding of these tools.

Saturday, January 14, 2012

Faster reading through math

Let’s face it, there is a lot of content on the web, and one thing I hate worse is reading halfway through an article and realizing that the title and first paragraph indicate little about the rest of the article. In effect, I check out the quick content first (usually after a link), and am disappointed.

My strategy now is to use automatic summaries, which are now a lot more accessible than they used to be. The algorithm has been around since 1958 (!) by H. P. Luhn and is described in books such as Mining the Social Web by Matthew Russell (where a Python implementation is given). With a little work, you can create a program that scrapes text from a blog, provides short and long summaries, and links to the original post, and packages it up in a neat HTML page.

Or you can use the cute interface in Safari, if you care to switch.

Wednesday, January 4, 2012

Competing in data mining competitions

I’m competing in several data mining competitions over at Kaggle. So far, I haven’t really done well, but I am learning a lot. Here’s what I’m getting out of it:

  • Variety in applying statistical techniques to real-world problems
  • Clarifying for myself what the bias-variance tradeoff really means
  • Trying new techniques, such as those I got out of the free online machine learning class
  • Humility

If you’re into statistics, you should try it! Kaggle isn’t the only competition forum in town, but it’s a good one. (Tunedit has one competition in classification of biomedical papers, and KDNuggets regularly announces contests from sites.

Tuesday, December 27, 2011

Lots of open education resources for your gadgetry

While not related exclusively to statistics, this resource does relate to open education. This page at OpenCulture.com gives a large list of resources of books, courses, and media you can use to fill your new (or old) gadget. They have a list of free online courses as well, with statistics falling under computer science, engineering, and mathematics.

Sounds like Christmas and New Year’s resolution wrapped up into one nice gift!